Statistics
Quick Links
📌 Why Statistics?
Plan staffing, track sales, and defend decisions with numbers. Compare periods, segment by tags, and export what stakeholders need.
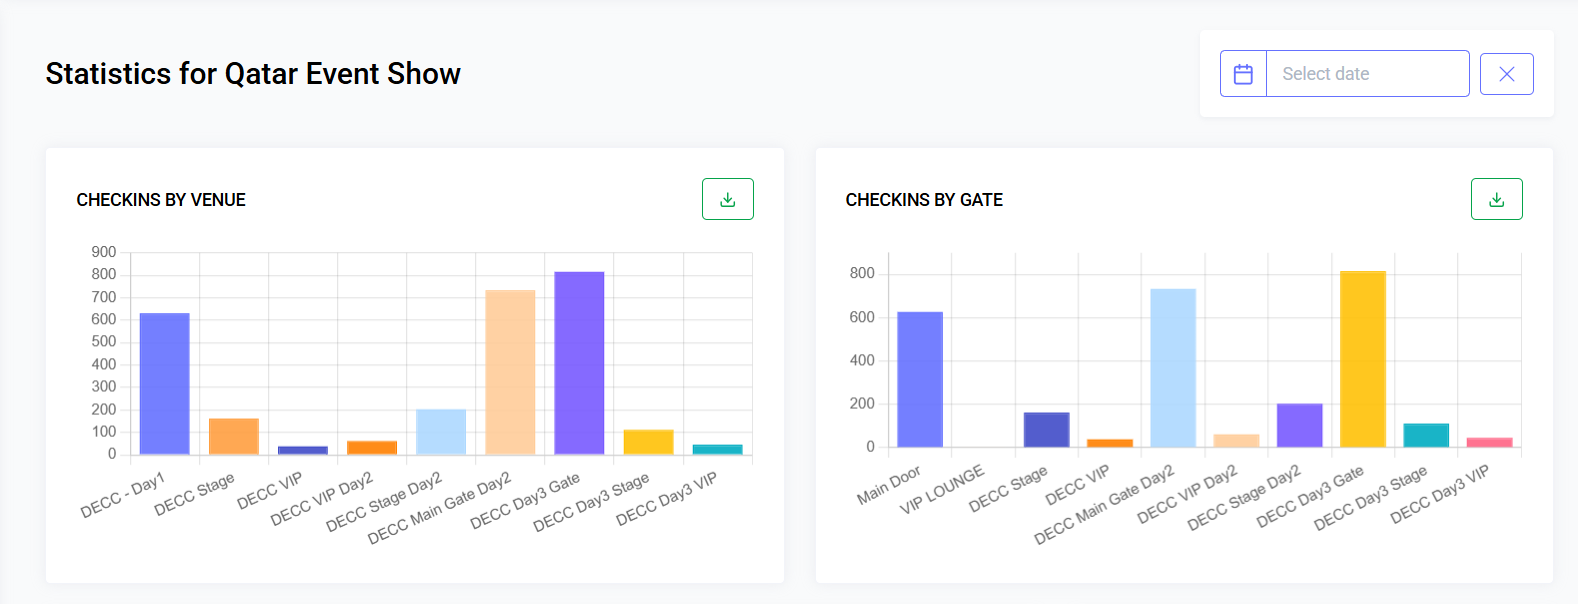
The Statistics module provides real-time and historical analytical insights for your events: registrations, attendance, ticket sales, revenue, engagement distribution, workshop utilization, and trends over time. It supports filtering, drill-downs, and exporting summarized or raw data.
Overview
- Analyze registrations, attendance, and revenue
- Drill-down into guest, ticket, order, and workshop data
- Export CSV/XLSX reports
- Apply segmentation filters and date ranges
Quick Start
- Go to Event > Statistics
- Select date range (e.g., Event Duration or Last 7 Days)
- Apply filters (Ticket Type, Tag, Country, Status, Workshop)
- Click any widget to drill down to the underlying list
- Use Export to download summary or detailed CSV/XLSX
Tip: Some revenue widgets are hidden without the
statistics.view.revenuepermission.
Navigation
- Event context: Use the event switcher if required
- Entry point: Event > Statistics
- Panels: Overview widgets at top; time series and breakdowns below
Common Tasks (How-tos)
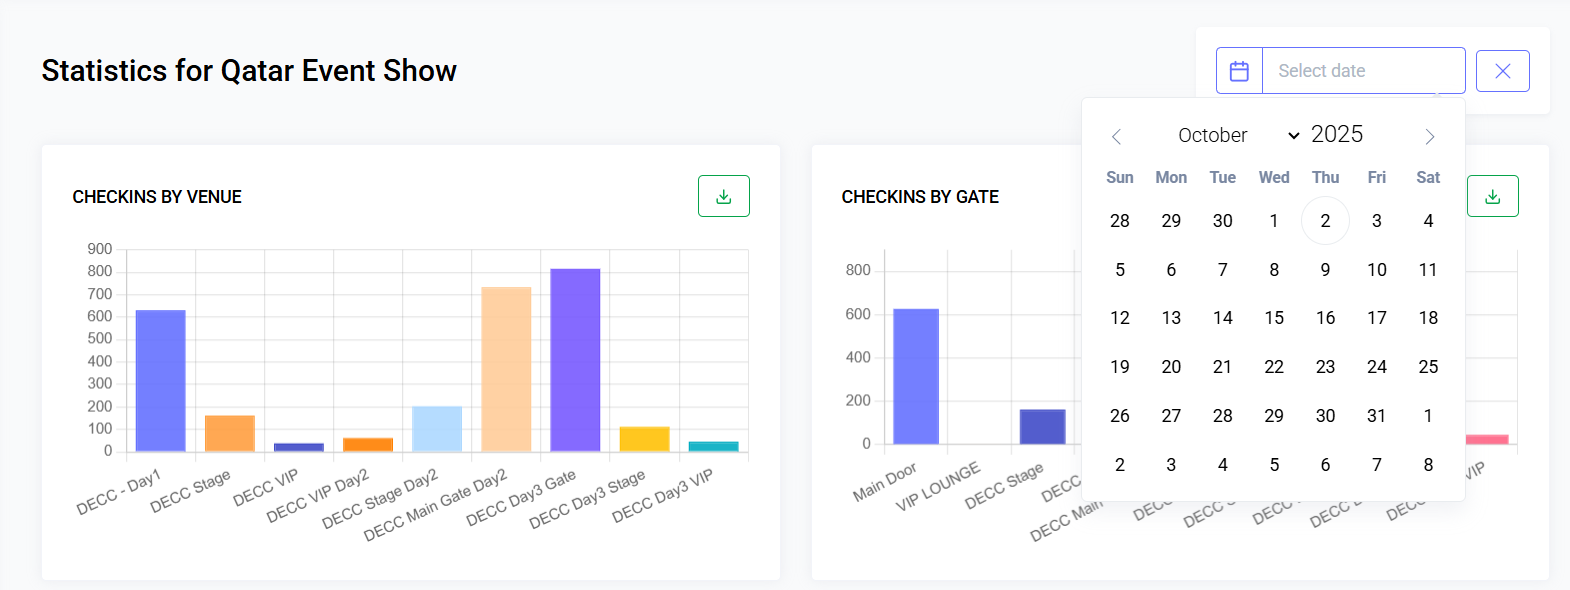
Change Date Range
- Click the date picker (top-right)
- Choose preset (This Week, Last 7 Days, Event Duration) or custom range
- Widgets and charts refresh automatically
Apply Filters
- Open Filters panel
- Select Ticket Type(s), Tag(s), Country, Status, or Workshop
- Apply — all widgets recompute with active filters
Drill Down to Records
- Click a widget (e.g., Check-Ins) to open detailed modal or filtered list
Export Data
- Click Export
- Choose scope: Summary, Guests, Orders, Check-Ins, Workshops
- Confirm; large exports are queued
Compare Periods (Optional)
- Toggle Compare on toolbar
- Select Previous Period or Same Period Last Year
- Delta indicators (▲ / ▼ with %) appear under numeric widgets
Save Dashboard View
- Save current filter/date as a named view for reuse
Refresh Data
- Click Refresh to bypass cache
- Panels may auto-refresh every configurable interval
Interpreting Numbers
| Metric | Description |
|---|---|
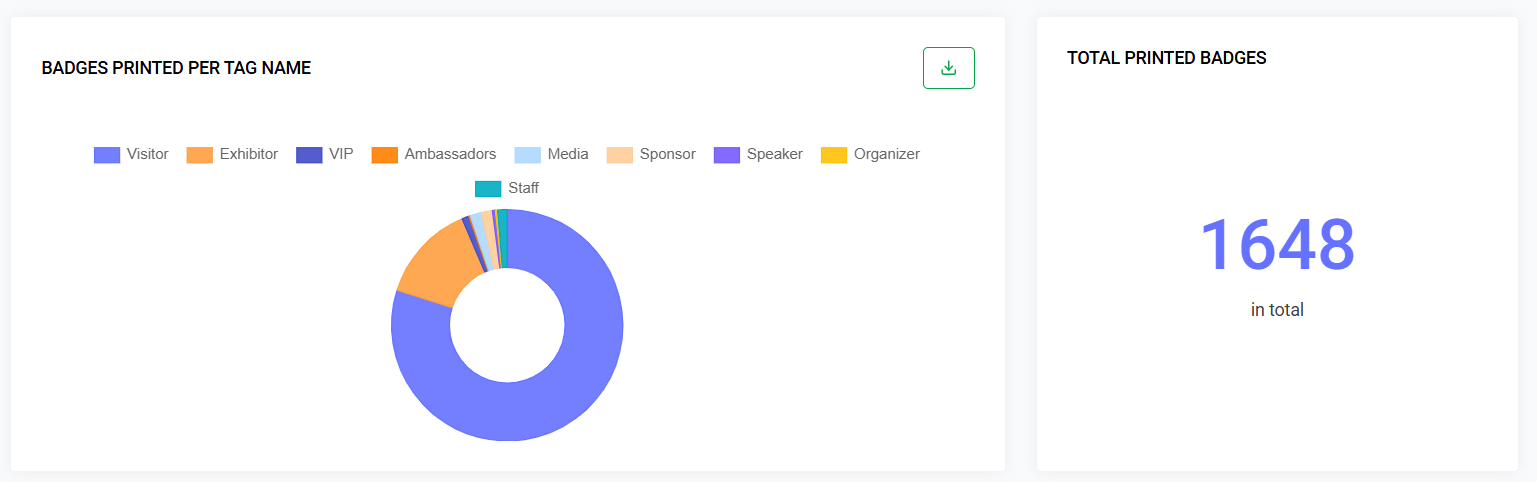
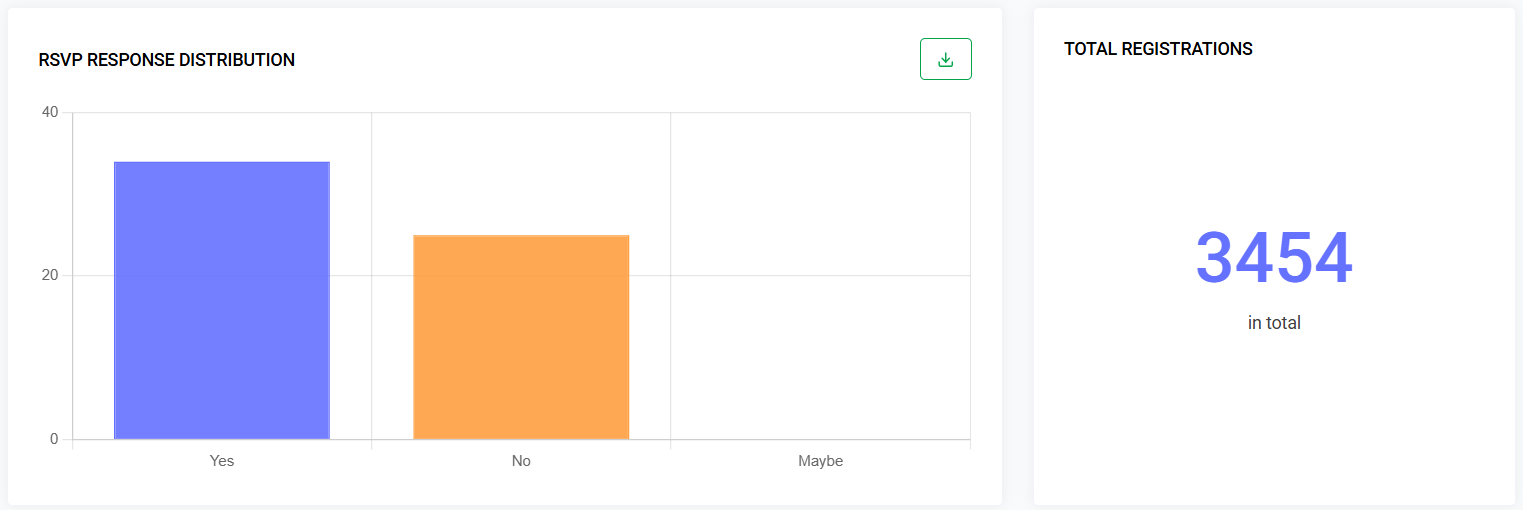
| Total Registrations | All guest records (any status) |
| Approved Guests | Guests in approved/active state |
| Pending / Rejected | Moderation counts |
| Check-Ins | Unique guests scanned or manually checked in |
| Check-In Rate | Check-Ins / Approved (%) |
| Tickets Sold | Count of tickets with successful payment |
| Revenue (Gross / Net) | Before/after fees and refunds (if permission allows) |
| Workshop Utilization | Seats taken / capacity per workshop |
| Registration Trend | Daily/weekly time series |
| Sales Velocity | Tickets sold over time bucket |
| Email Engagement | Open/click % (optional) |
Workflow
1. Open Statistics Module
- Ensure an event is selected
- Navigate: Event > Statistics
- Dashboard loads default date range (Event Lifecycle / Last 30 Days)
2. Adjust Date / Time Range
- Use date picker (Single day, Range, Quick presets)
- Charts refresh automatically
- Some metrics (e.g., total registrations) may ignore filters unless “Filter by Creation Date” is enabled
3. Apply Segmentation Filters
| Filter | Purpose |
|---|---|
| Ticket Type | Metrics for selected tickets only |
| Tag | Guests with selected tag(s) |
| Status | Registration status |
| Country | Geographic segmentation |
| Workshop | Metrics for workshop participants |
4. Drill-Down
- Click a widget to view detailed data (modal or redirected list)
- Drill-down inherits active filters
5. Export Data
| Export Type | Contents |
|---|---|
| Summary | High-level metrics snapshot |
| Guests | Filtered guest list with tags and status |
| Orders | Filtered orders with financial fields |
| Check-Ins | Timestamped attendance log |
| Workshops | Enrollment + utilization per session |
6. Refresh / Auto-Update
- Real-time panels may auto-refresh every N seconds
- Manual Refresh forces recompute
7. Compare Periods
- Toggle Compare → Previous Period / Same Period Last Year
- ▲ / ▼ with % change shows under numeric widgets
8. Save Dashboard View
- Save current filters and layout for future reuse
Performance & Caching
| Layer | Strategy |
|---|---|
| Heavy aggregates | Cached per event + filter hash (TTL ~60s) |
| Time series | Pre-aggregated nightly + real-time append |
| Drill-down queries | Uncached; optimized indexes |
Invalidate cache on guest/ticket/order mutation events or manual refresh.
Permissions
| Action | Permission |
|---|---|
| View Statistics | statistics.view |
| Export Summary | statistics.export.summary |
| Export Guests | statistics.export.guests |
| Export Orders | statistics.export.orders |
| View Revenue Panels | statistics.view.revenue |
Revenue panels hidden if user lacks permission.
Data Sources (Conceptual)
- guests: status, created_at, country, tags
- tickets: price, type, capacity
- orders: status, total, currency
- transactions: payment timestamps
- checkins: guest_id, scanned_at, gate
- workshops / workshop_registrations
- emails / email_metrics (optional)
Edge Cases & Considerations
| Scenario | Handling |
|---|---|
| Timezone shift | Display adjusted; UTC stored internally |
| Deleted ticket type | Historical metrics retain counts; may show as (Archived) |
| Partial refunds | Revenue net panel subtracts refunded portions |
| Guest merged | Counts recalculated nightly |
| High volume (>100k) | Rolling pre-aggregation + paginated drill-down |
Troubleshooting
| Issue | Resolution |
|---|---|
| Metrics stale | Click Refresh; ensure async aggregation queue running |
| Revenue blank | Permission missing or gateway sync incomplete |
| Export empty | Filters too restrictive; clear and retry |
| Slow loading | Check DB indexes on created_at / event_id / status |
| Time mismatch | Confirm user timezone preference |
Best Practices
- Limit simultaneous heavy exports during live events
- Use comparative mode to evaluate campaign impact
- Export attendance post-event for auditing
- Segment by tags for targeted campaign insights
Future Enhancements (Roadmap Ideas)
- Predictive attendance forecasting (ML)
- Real-time anomaly alerts (e.g., failed payments spike)
- Cohort retention across multi-day events
- Webhook notifications for thresholds (e.g., 90% capacity)
- Custom KPI builder with formulas
Last updated: 2025-10-09